Been very busy lately, not able to cope with updating for personal pages and publications. The latest papers, please refer to my Google Scholar, which Google kindly collected it for me.
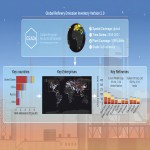
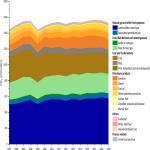
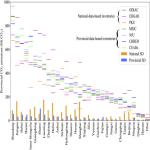
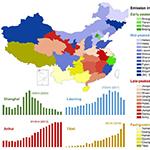
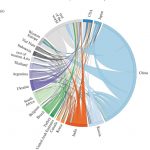
 Energy-related CO2 emission accounts and datasets for 40 emerging economies in 2010–2019
Earth System Science Data | Mar 22, 2023
Here, we redress the balance by establishing a dataset for an energy-related CO2 emission inventory that covers 47 sectors and eight energy types in 40 emerging economies (https://doi.org/10.5281/zenodo.7309360, Cui et al., 2021).
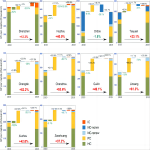
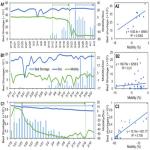
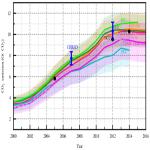
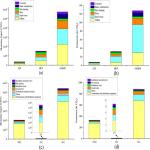
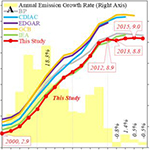
 Global oil refining's contribution to greenhouse gas emissions from 2000 to 2021
The Innovation | January 30, 2023
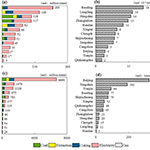
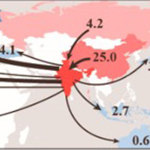
Here, we established a global sub-refinery GHG emission dataset in a long time series based on life cycle method. Globally, cumulative GHG emissions from refineries reached approximately 34.1 gigatons (Gt) in the period 2000–2021 with an average annual increasing rate of 0.7%, dominated by the United States, EU27&UK, and China.
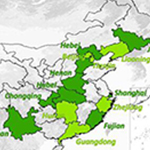
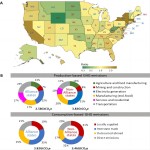 Can US multi-state climate mitigation agreements work? A perspective from embedded emission flows
Global Environmental Change | November 02, 2022
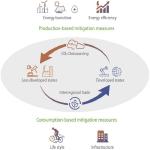
We examine emission transfers between the states that have joined the U.S. Climate Alliance (USCA) and others. Our results show that states pledging to curb emissions consistent with the Paris Agreement were responsible for approximately 40% of total U.S. territorial GHG emissions.
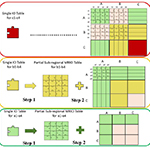
 Entropy-based Chinese city-level MRIO table framework
Economic Systems Research | June 27, 2021
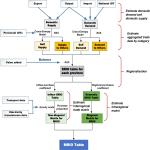
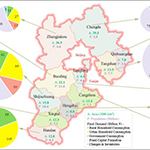
Here we propose an entropy-based framework to construct city-level MRIO tables. We demonstrate the new construction method and present an analysis of the carbon footprint of cities in China's Hebei province.
 Sustainable development pathways for Chinese cities: an assessment of the advanced inclusive wealth index
Earth's Future | August 30, 2022
To explore sustainability more comprehensively in this context, this paper improves the inclusive wealth (IW) system proposed by the United Nations Environment Programme by extending the definition of intangible capital and refining the classification of different types of capital.
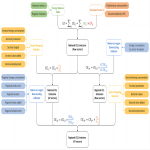
 Using a linear regression approach to sequential interindustry model for time-lagged economic impact analysis
Structural Change and Economic Dynamics | March 29, 2022
In this study, we present an innovative algorithm that integrates linear regression techniques into a derivative of the IO method, the Sequential Interindustry Model (SIM), to overcome the inherent shortcomings of statistical lags in conventional IO studies. The regressed relationship can thus be used to predict, in the short term, the accumulated chronological impacts induced by fluctuations in sectorial economic demands under disequilibrium conditions.
 Full-scale, near real-time multi-regional input–output table for the global emerging economies (EMERGING)
Journal of Industrial Ecology | May 24, 2022
Our study presents EMERGING: Up-to-date and full-scale MRIO tables covering 135 sectors in 245 economies over the period from 2015 to 2019. We describe in detail the steps in the development of the database and reconciliation and validation of bilateral trade data and national statistics.
 Environmentally vulnerable or sensitive groups exhibiting varying concerns toward air pollution can drive government response to improve air quality
iScience | June 17, 2022
Here, we extract 3.8 million haze-related posts from China’s Sina Weibo and analyze the concerns raised by these groups by constructing an air pollution notability index. The results show that protection is the key theme for women aged 20–35 years, while elderly individuals are easily influenced by haze-related product ads yet lack awareness of scientific-based protection.
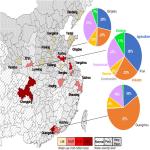
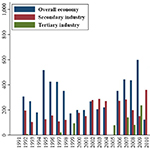
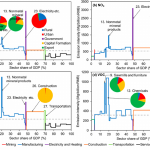
 Trends, drivers, and mitigation of CO2 emissions in the guangdong–hong kong–macao greater bay area
Engeering | May 25, 2022
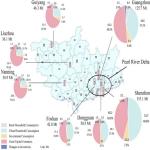
The Guangdong–Hong Kong–Macao Greater Bay Area (GBA) is a national initiative aimed at building a world-class city cluster in China and whose trends. This study compiled the CO2 emission inventories of the GBA from 2000 to 2019 and explored the key drivers of CO2 emissions using the logarithmic mean Divisia index method.
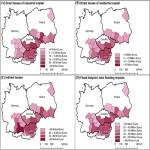
 Emission accounting and drivers in East African countries
Applied Energy | April 15, 2022
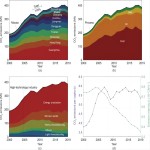
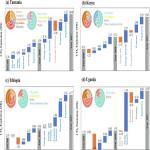
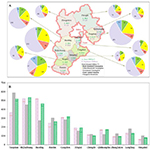
Here we found that overall the CO2 emissions show a ’two-stage exponential growth’ pattern, with significant heterogeneity between countries. In terms of the energy mix, technical progress in hydro and geothermal energy was almost offset by a growing appetite for oil and coal, making it the weak and valuable factor driving emissions reduction (− 1.4Mt).
 Using a Linear Regression Approach to Sequential Interindustry Model for Time-Lagged Economic Impact Analysis
Structural Change and Economic Dynamics | March 29, 2022
In this study, we present an innovative algorithm that integrates linear regression techniques into a derivative of the IO method, to overcome the inherent shortcomings of statistical lags in conventional IO studies. The regressed relationship can thus be used to predict, in the short term, the accumulated chronological impacts induced by fluctuations in sectorial economic demands under disequilibrium conditions.
 Large inter-city inequality in consumption-based CO2 emissions for China's pearl river basin cities
Resources, Conservation and Recycling | January, 2022
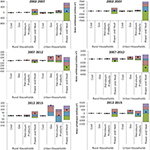
We compiled a consumption-based inventory of 47 cities in the Basin for 2012. We found that the total consumption-based emissions of 47 cities was 933.8 Mt, accounting for 13.1% of China's emissions. There were huge differences in the consumption-based emissions, ranging from 3.6 Mt (Heyuan City) to 153.1 Mt (Shenzhen City).
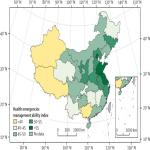
 The 2021 China report of the Lancet Countdown on health and climate change: seizing the window of opportunity
The Lancet Public Health | December, 2021
This 2021 report is the first annual update, presenting 25 indicators within five domains: climate change impacts, exposures, and vulnerability; adaptation, planning, and resilience for health; mitigation actions and health co-benefits; economics and finance; and public and political engagement.
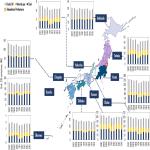
 Monthly direct and indirect greenhouse gases emissions from household consumption in the major Japanese cities
Scientific Data | November 23, 2021
We construct an emission inventory of urban household emissions for 52 major cities in Japan that covers around 500 emission categories. The dataset spans from January 2011 to December 2015 and contains 12,384 data records for direct emissions and 1,543,128 records for indirect emissions.
 Heterogeneity of consumption-based carbon emissions and driving forces in Indian states
Advances in Applied Energy | November 19, 2021
In this paper, we first applied a multi-regional input-output model to ascertain heterogeneity in consumption-based emissions and track carbon flows in the inter-state supply chain, using our newly constructed Indian multi-state input-output table for 2015, based on Flegg location quotient method.
 Decoupling without outsourcing? How China’s consumption-based CO2 emissions have plateaued
Iscience | October 22, 2021
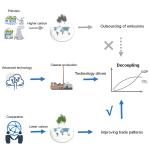
By using multi-region input-output analysis, we find that China’s relative decoupling in the new normal is technology driven, evidenced by the narrowing gap between its technology-adjusted and non-adjusted consumption emissions. We further explore the driving forces behind the slowdown in China’s imported emissions growth, finding that it is attributable to restructuring of import patterns resulting from changes in the structures of domestic demand.
 Chinese provincial multi-regional input-output database for 2012, 2015, and 2017
Scientific Data | September 22, 2021
We present MRIO tables for 2012, 2015, and 2017 for 31 provinces of mainland China in 42 economic sectors. We employ hybrid methods to construct the MRIO tables according to the available data for each year.
 Entropy-based Chinese city-level MRIO table framework
Economic Systems Research | June 27, 2021
Here we propose an entropy-based framework to construct city-level MRIO tables. We demonstrate the new construction method and present an analysis of the carbon footprint of cities in China's Hebei province. A sensitivity analysis is conducted by introducing a weight reflecting the heterogeneity between city and province data.
 Virtual carbon and water flows embodied in global fashion trade-a case study of denim products
Journal of Cleaner Production | June 20, 2021
Virtual carbon embodied in the global denim trade increased obviously from 14.8 Mt CO2e in 2001 to 16.0 Mt CO2e in 2018, and the virtual water consumption dropped from 5.6 billion m3 to 4.7 billion m3 from 2001 to 2018.
 Japanese carbon emissions patterns shifted following the 2008 financial crisis and the 2011 Tohoku earthquake
Communications Earth & Environment | June 15, 2021
We explore the national and regional carbon emission patterns (and their drivers) for the main economic sectors in Japan between 2007 and 2015, a period shaped by the 2008 financial crisis and the 2011 Tohoku Earthquake. Following the 2011 earthquake the previously decreasing regional emissions patterns started increasing in practically all regions except Hokkaido.
 Assessing the economic impacts of future fluvial flooding in six countries under climate change and socio-economic development
Climatic Change | June 07, 2021
This study presents an integrated flood risk analysis framework to calculate total economic damages, with and without socio-economic development, under a range of warming levels from < 1.5 to 4 °C in Brazil, China, India, Egypt, Ethiopia, and Ghana.
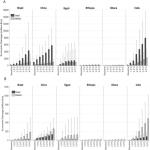
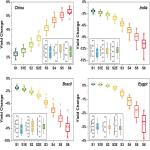 Economic impacts of climate-induced crop yield changes: evidence from agri-food industries in six countries
Climatic Change | June 03, 2021
This study assesses the economic impacts of eight scenarios of warming, from 1.5 to 4 °C, on rice and wheat yields in China, India, Brazil, Egypt, Ghana and Ethiopia. The role of both natural and social factors in crop production is considered by coupling a statistical crop model (ClimaCrop) and a global economic model (GTAP). Changes in economic outputs, consumer and producer prices and national economic welfare are presented.
 Supply chain effects of China’s fast growing marine economy on greenhouse gas emissions
Environmental Research Letters | May 10, 2021
Through compiling high-resolution and time-series environmental input–output tables for 2002, 2007, 2012 and 2017, this study quantify development of 13 key marine industries in driving national economic development and its supply chains, and assesses the direct and indirect contributions of marine industries to the national economy and GHGs emissions.
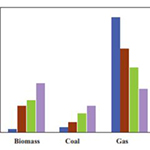
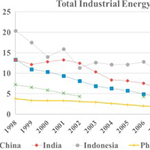
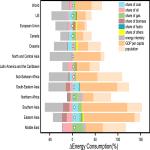 The driving forces behind the change in energy consumption in developing countries
Environmental Research Letters | April 14, 2021
We analyze the long time series of energy consumption for China, India, Indonesia, Myanmar and Bangladesh since the 1970s. Despite economic development and population growth accelerating energy consumption substantially upward, energy intensity made energy consumption decrease. Coal and oil dominated the energy transition pathway in China and India, while biomass and natural gas dominated in Indonesia, Myanmar and Bangladesh.
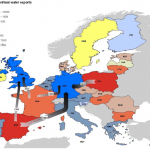
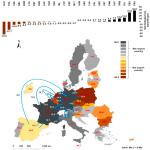 Unsustainable imbalances and inequities in Carbon-Water-Energy flows across the EU27
Renewable and Sustainable Energy Reviews | March, 2021
In this paper, an EU27 multiregional input-output model, at a sector level to identify the inter-regional and -sectoral CWE flows, and clarify the regional, sectoral and worldwide patterns of EU27 CWE network is presented. The results revealed an environmental inequality across the EU27 and impacts on the rest of the world.
 CO2 emission accounts of Russia’s constituent entities 2005–2019
Scientific Data | July 13, 2021
The CO2 emission inventories of Russia and its 82 constituent entities from 2005 to 2019 are constructed. The emission inventories include energy-related emissions with 89 socio-economic sectors and 17 energy types and process-related emissions.
 Reduction of Human Mobility Matters during Early COVID-19 Outbreaks: Evidence from India, Japan and China
International Journal of Environmental Research and Public Health | March 04, 2021
This study quantified the importance of inter- and intra-country mobility in containing virus spread and avoiding hospitalizations during early stages of COVID-19 outbreaks in India, Japan, and China. We calculated the time-varying reproductive number (Rt) and duration from illness onset to diagnosis confirmation (Doc), to represent conditions of virus spread and hospital bed shortages, respectively.
 The 2020 China report of the Lancet Countdown on health and climate change
The Lancet Public Health | January, 2021
This report aims to understand and track the links between public health and climate change at the national level. This paper is one part of the Lancet Countdown's broader efforts to develop regional expertise and understanding. Uniquely, the data and results in this report are presented at the provincial level where possible, to facilitate the targeted response strategies for local decision makers.
 Province-level fossil fuel CO2 emission estimates for China based on seven inventories
Journal of Cleaner Production | December 20, 2020
We collected and analyzed 7 published emission datasets to comprehensively evaluate the spatiotemporal distribution of provincial CO emissions. We found that the provincial emissions ranged from 20 to 649 Mt CO and that the standard deviations (SDs) ranged from 8 to 159 Mt.
 Evaluating China's fossil-fuel CO2 emissions from a comprehensive dataset of nine inventories
Atmospheric Chemistry and Physics | October 06, 2020
we evaluated China's FFCO2 emissions from nine published global and regional emission datasets. These datasets show that the total emissions increased from 3.4 (3.0–3.7) in 2000 to 9.8 (9.2–10.4) Gt CO2 yr−1 in 2016.
 A 2015 inventory of embodied carbon emissions for Chinese power transmission infrastructure projects
Scientific Data | October 01, 2020
This study for the first time compiles an embodied carbon emissions inventory covering 191 typical power transmission infrastructure projects in China in 2015, including 145 types of alternating current (AC) transmission line projects, 37 typical AC substation projects, 8 typical direct current (DC) transmission line projects and 1 typical DC converter station project.
 Embodied carbon emissions in China-US trade
Science China Earth Sciences | August 07, 2020
we quantify the embodied carbon emissions (the “virtual” emissions associated with trade and consumption) in China-US trade by constructing a carbon dioxide emissions inventory and a multiregional input-output model.
 City‐level water withdrawal in China: Accounting methodology and applications
Journal of Industrial Ecology | March 09, 2020
We develop a general framework to, for the first time, estimate the water withdrawal of 58 economic–social–environmental sectors in cities in China. This methodology was applied because only inconsistent water statistics collected from different data sources at the city level are available. We applied it to 18 representative Chinese cities.
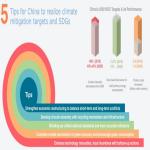 Five tips for China to realize its co-targets of climate mitigation and Sustainable Development Goals (SDGs)
Geography and Sustainability | September, 2020
We proposed five recommendations, which include: restructuring the economy to balance short-term and long-term conflicts; developing circular economy with recycling mechanism and infrastructure; building up unified national standards and more accurate indicators; completing market mechanism for green economy and encouraging green consumption; and enhancing technology innovations and local incentives via bottom-up actions.
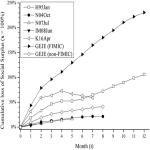 Supply Constraint from Earthquakes in Japan in Input–Output Analysis
Risk analysis | June 07, 2020
Japan's largest five earthquakes from 1995 to 2017 and the Great East Japan Earthquake (GEJE) in March 2011. The worst earthquake at the peak tends to increase price by 10–20% and decrease SS by 20–30%, when compared with the initial month's prices/production.
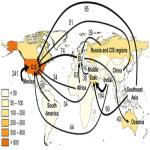 CO2 Emissions Embodied in International Migration from 1995 to 2015
Environmental Science & Technology | August 31, 2020
the CO2 footprint of international immigrants has increased from 1.8 gigatonnes (Gt) in 1995 to 2.9 Gt in 2015. In 2015, the U.S. had the largest total and per capita CO2 emissions caused by international immigrants. Oceania and the Middle East are highlighted for their large portions of immigrant-caused CO2 emissions in total CO2 emissions (around 20%).
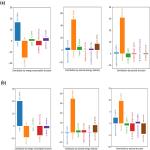 Enlarging regional disparities in energy intensity within China
Earth's Future | July 17, 2020
China's interprovince disparities in energy intensity increase and are exacerbated by the enlarging disparities in energy intensity between the least developed and most developed regions of China. The causes for this phenomenon are as follows: (i) rather loose regulatory measures on mitigating coal consumption; (ii) inferior energy processing technology in areas specializing in energy-intensive industries; (iii) increasing interregional energy fluxes embodied in trade; and (iv) separate jurisdictions at provincial administrative levels.
 Flood footprint assessment: a multiregional case of 2009 central European floods
Risk analysis | May 25, 2020
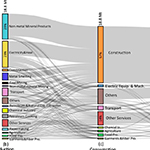
indirect losses represent a considerable proportion of the total costs of a natural disaster, and most of them occur in nonhighly directly impacted industries. For the 2009 Central European Floods, the indirect losses represent 65% out of total, and 70% of it comes from four industries: business services, manufacture general, construction, and commerce.
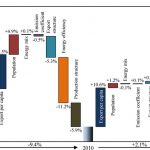
 Dynamic driving forces of India's emissions from production and consumption perspectives
Earth's Future | May 11, 2020
India's per capita consumption has a significant raising effect on India's consumption-based emissions during 2000–2014; increasing coal proportion (especially in industry and electricity) and ineffective energy efficiency (especially in electricity) continuously push India's production-based emissions upwards after 2003. Meanwhile, India's domestic industrial chain shows increasing and decreasing effects on domestic consumption and export-related emissions after 2011, respectively.
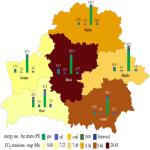 Low-carbon development via greening global value chains: a case study of Belarus
Proceedings of the Royal Society A | July 29, 2020
Belarus has a relatively clean energy structure with 75% of Belarus' energy consumption coming from imported natural gas. The ‘chemical, rubber and plastic products' sector has expanded significantly over the past few years; its territorial-based emissions increased 10-fold from 2011 to 2014, with the ‘food processing' sector displaying the largest increase in consumption-based emissions.
 Japan prefectural emission accounts and socioeconomic data 2007 to 2015
Scientific data | July 13, 2020
This work contributes to a time-series emission with a record of 47 prefectures in Japan as well as their associated socioeconomic features. The compiled emission inventory is based on three major fossil fuels and 26 sectors with careful emission allocations for regional electricity generation.
 Regional determinants of China’s consumption-based emissions in the economic transition
Environmental Research Letters | June 18, 2020
China's consumption-based emissions peaked in 2013, largely driven by a peak in consumption-based emissions from developing regions. Declined intensity and industrial structures are determinants due to the economic transition. The rise of the Southwest and Central regions of China have become a new feature, driving up emissions embodied in trade and have reinforced the pattern of carbon flows in the post-financial crisis period.
 Methodology and application of flood footprint accounting in a hypothetical multiple two-flood event
Philosophical Transactions of the Royal Society A | February 17, 2020
this study proposes a more externally oriented methodology for indirect flood footprint accounting and offers various extensive sensitivity analyses based on a hypothetical two-flood event. We conclude that the total flood footprint of a multi-flood within a given region is larger than the sum of individual flood footprints and this is the same for the IFF due to the combination effect, while the flood footprint is highly constrained by factors.
 Environmental regulation and enterprise innovation: a review
Business Strategy and the Environment | January 15, 2020
we propose five potential research directions: quantifying the degree of enterprise innovation caused by environmental regulation, the impacts of environmental regulation on sustainable economic development from an enterprise ecosystem perspective, the impacts of enterprise innovation on environmental regulation, the role of enterprise initiative in the relationship between environmental regulation and enterprise innovation, and social security issues and the integration of eliminated enterprises resulting from environmental regulation.
 China CO2 emission accounts 2016–2017
Scientific Data | February 13, 2020
This study constructs the most up-to-date CO2 emission inventories for China and its 30 provinces, as well as their energy inventories for the years 2016 and 2017. The newly compiled inventories provide key updates and supplements to our previous emission dataset for 1997–2015. The inventories are constructed for 47 economic sectors consistent with the national economic accounting system.
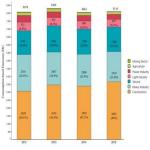
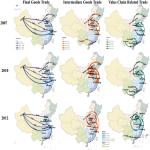 Carbon transfer within China: Insights from production fragmentation
Energy Economics | February, 2020
Results showed that inter-provincial trade within China reduced the national carbon emissions by 208 Mt. and 114 Mt. in 2007 and 2012. The first two trade patterns contributed to the reduction, while value-chain-related trade resulted in carbon growth. The four trillion yuan stimulus package promoted the development of energy intensive industries while inter-provincial trade increased national carbon emissions by 247 Mt. in 2010.
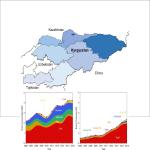 Carbon emissions in countries that failed to ratify the intended nationally determined contributions: A case study of Kyrgyzstan
Journal of Environmental Management | February 01, 2020
The empirical results revealed that CO2 emissions in Kyrgyzstan depicted a wavelike rise from 2007 to 2015. Kyrgyzstan transferred large quantities of CO2 emissions to China and Russia through imports. However, if all manufacturing imports were produced within Kyrgyzstan, the emission would be over five times compared to the current level.
 Drivers of provincial SO2 emissions in China–Based on multi-regional input-output analysis
Journal of Cleaner Production | November 20, 2019
Studying the driving factors of pollutant emissions is of great significance for China in the formulation of pollution control strategies. Existing studies mainly focus on the causes of national aggregate emission changes. However, considering the large differences among provinces in China and their close economic linkages, it is necessary to develop a provincial-level analysis to shape provincial policies for emission reduction.
 Kazakhstan's CO2 emissions in the post-Kyoto Protocol era: Production-and consumption-based analysis
Journal of environmental management | November 1, 2019
Kazakhstan is an important energy export country and a pivot of the “Belt and Road Initiative” (BRI). Despite its emissions are relatively small compared with huge emitters such as China and the US, Kazakhstan also faces great pressure in terms of CO2 emission reduction and green development.
 Can virtual water trade save water resources?
Water research | October 10, 2019
At times, certain areas of China suffering from water shortages. While China's government is spurring innovation and infrastructure to help head off such problems, it may be that some water conservation could help as well. It is well-known that water is embodied in traded goods—so called “virtual water trade” (VWT). In China, it seems that many water-poor areas are perversely engaged in VWT. Further, China is engaging in the global trend of fragmentation in production, even as an interregional phenomenon.
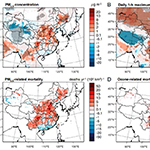 Impacts of climate change on future air quality and human health in China
Proceedings of the National Academy of Sciences | August 12, 2019
In recent years, air pollution has caused more than 1 million deaths per year in China, making it a major focus of public health efforts. However, future climate change may exacerbate such human health impacts by increasing the frequency and duration of weather conditions that enhance air pollution exposure. Here, we use a combination of climate, air quality, and epidemiological models to assess future air pollution deaths in a changing climate under Representative Concentration Pathway 4.5 (RCP4.5).
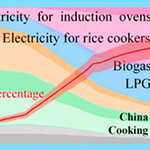 Energy and air pollution benefits of household fuel policies in northern China
Proceedings of the National Academy of Sciences | August 5, 2019
In addition to many recent actions taken to reduce emissions from energy production, industry, and transportation, a new campaign substituting residential solid fuels with electricity or natural gas has been launched in Beijing, Tianjin, and 26 other municipalities in northern China, aiming at solving severe ambient air pollution in the region. Quantitative analysis shows that the campaign can accelerate residential energy transition significantly.
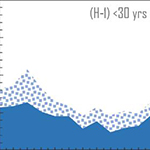 Unequal age-based household emission and its monthly variation embodied in energy consumption–A cases study of Tokyo, Japan
Applied Energy | August 1, 2019
City is the main place to consume goods and services throughout the world. Among the various consumption terminals, household-level consumption is highly behavior driven, which can be affected by various factors such as household income level, age, living environment etc. However, city-level household emissions characteristics are still not fully understood due to the complexity of consumption behaviors and the lack of the supply chain’s data.
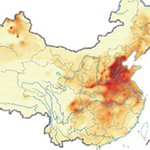 Rapid improvement of PM2.5 pollution and associated health benefits in China during 2013–2017
SCIENCE CHINA Earth Sciences | July 2, 2019
In this work, we investigated changes in PM2.5 exposure and the associated health impacts in China for the period 2013–2017. We used an optimal estimator of PM2.5 combining in-situ observations, satellite measurements, and simulations from a chemical transport model.
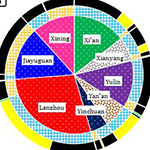 Structural patterns of city-level CO2 emissions in Northwest China
Journal of Cleaner Production | June 20, 2019
In Northwest China, quantifying city-level CO2 emissions is fundamental to CO2 alleviation but encounters difficulties in data availability and quality. Further, structuring city-level emissions could be conductive to CO2 reduction. This study applies a practical methodology to 16 northwestern Chinese cities to grasp their historical trajectories of CO2 emissions. Then, structuring CO2 emissions is explored in terms of industrial structure, energy mix and urban-rural disparities for 8 northwestern Chinese cities.
 Regional development and carbon emissions in China
Energy Economics | June 1, 2019
China announced at the Paris Climate Change Conference in 2015 that the country would reach peak carbon emissions around 2030. Since then, widespread attention has been devoted to determining when and how this goal will be achieved. This study aims to explore the role of China's changing regional development patterns in the achievement of this goal. This study uses the logarithmic mean Divisia index (LMDI) to estimate seven socioeconomic drivers of the changes in CO2 emissions in China since 2000.
 Initial Declines in China’s Provincial Energy Consumption and Their Drivers
Joule | May 15, 2019
The years from 2003 to 2016 chronicle China’s three distinct periods, characterized by fast economic expansion from 2003 to 2007, the fall and recovery of the economy under the strike of global financial crisis from 2007 to 2011, and the strategic adjustment from 2011 to 2016, known as China’s ‘‘new normal’’ period (a slowdown of economic growth to around 7%) aimed at ‘‘low but high-quality growth.’’ In the wake of this economic cycle, China’s energy consumption was also in a state of flux. From 2003 to 2007.
 Does the rebound effect matter in energy import-dependent mega-cities? Evidence from Shanghai (China)
Applied energy | May 1, 2019
The energy rebound effect is regarded as an obstacle of achieving the expected target of energy-saving policies, especially under a rapid urbanization background in developing counties, such as China. This has become a substantial drag of sustainable development in some cities. Shanghai is the economic center of China, and it is also a typical energy import-dependent mega-city.
 Review on city-level carbon accounting
Environmental science & technology | May 1, 2019
Carbon accounting results for the same city can differ due to differences in protocols, methods, and data sources. A critical review of these differences and the connection among them can help to bridge our knowledge between university-based researchers and protocol practitioners in accounting and taking further mitigation actions. The purpose of this study is to provide a review of published research and protocols related to city carbon accounting, paying attention to both their science and practical actions.
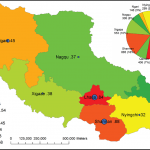
 Frequent interactions of Tibet's CO2 emissions with those of other regions in China
Earth's Future | March 28, 2019
Tibet is usually missing from China's emission accounts, especially from those of consumption‐based emissions. In this study, we developed a multiregional input‐output table for 31 provinces in China and examined the production‐ and consumption‐based characteristics of Tibet's CO2 emissions in 2012. Results show that the consumption‐based CO2 emissions in Tibet (18.8 Mt, similar to Guinea's emissions in 2015) were three times as high as the production‐based estimate (6.2 Mt).
 Assessing the economic impacts of IT service shutdown during the York flood of 2015 in the UK
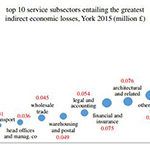
Proceedings of the Royal Society A | April 17, 2019
In this paper we focus on the ‘Christmas’ flood in York (UK), 2015. The case is special in the sense that little infrastructure was lost or damaged, while a single industry (IT services) was completely knocked out for a limited time. Due to these characteristics, the standard modelling techniques are no longer appropriate. An alternative option is provided by the Hypothetical Extraction Method, or HEM.
 Socioeconomic and atmospheric factors affecting aerosol radiative forcing: Production-based versus consumption-based perspective
Atmospheric environment | March 1, 2019
There exist substantial differences in top-of-atmosphere direct radiative forcing of aerosols due to a region's economic production (RFp) and consumption (RFc), in the context of economic globalization, trade and globalizing air pollution. Yet an explicit systematic analysis of all socioeconomic and atmospheric factors determining the RF difference is lacking. Here, we evaluate five socioeconomic (population, per capita output, emission intensity).
 Linking city‐level input–output table to urban energy footprint: Construction framework and application
Journal of Industrial Ecology | February 25, 2019
The current resolution of most MRIO models fails to capture the heterogeneity between subregions, especially in cities. The lack of city‐level MRIO tables has impeded the accomplishment of city‐level studies and hampered the understanding of the relationship between urban growth and consumption, and teleconnections to other regions.
 Peak cement‐related CO2 emissions and the changes in drivers in China
Journal of Industrial Ecology | February 8, 2019
The cement industry is the major source of process‐related emissions, and more attention should be paid to this industry. This study calculates the process‐related, direct fossil fuel–related, and indirect electricity‐related emissions from China's cement industry. The study finds that China's cement‐related emissions peaked in 2014. The emissions are, for the first time, divided into seven parts based on the cement used in different new building types.
 City-level water-energy nexus in Beijing-Tianjin-Hebei region
Applied energy | February 1, 2019
Water-energy nexus in a city can either prompt or undermine its development. Yet in China, the relevant research is rarely found. This study accounts the city-level water-energy nexus in Beijing-Tianjin-Hebei region in 2012 from both production and consumption perspectives, where input-output analysis based on city-level input-output tables are applied to conduct consumption-based accounts. Regarding water for energy, Beijing, Tianjin and Tangshan occupy the largest amounts of water for production in the energy sector.
 Life-cycle water uses for energy consumption of Chinese households from 2002 to 2015
Journal of environmental management | February 1, 2019
China's household energy demands' life-cycle water uses from 2002 to 2015 are quantified with an Input-Output analysis disaggregating rural and urban impacts. 9.73 and 1.60 km3 of water was withdrawn and consumed respectively in the life cycle of Chinese household energy demands in 2015, which was dominated by power and heat uses.
 Carbon emissions of cities from a consumption-based perspective
Applied energy | February 1, 2019
Carbon emission inventories are the foundations of climate change mitigation and adaptation in cities. In this study, we estimated production-based CO2 emissions from fossil fuel combustion and industrial processes in eleven cities in Hebei Province of China in 2012 and used input-output theory to measure their consumption-based CO2 emissions. By comprehensively comparing production- and consumption-based emissions, we found that six developed cities were consumers with import-depended trade patterns.
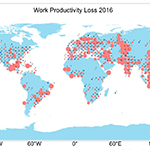 Loss of work productivity in a warming world: Differences between developed and developing countries
Journal of cleaner production | January 20, 2019
Comparable estimates of the heat-related work productivity loss (WPL) in different countries over the world are difficult partly due to the lack of exact measures and comparable data for different counties. In this study, we analysed 4363 responses to a global online survey on the WPL during heat waves in 2016. The participants were from both developed and developing countries, facilitating estimates of the heat-related WPL across the world for the year.
 Characterising climate change discourse on social media during extreme weather events
Global Environmental Change | November 28, 2018
When extreme weather events occur, people often turn to social media platforms to share information, opinions and experiences. One of the topics commonly discussed is the role climate change may or may not have played in influencing an event. Here, we examine Twitter posts that mentioned climate change in the context of three high-magnitude extreme weather events – Hurricane Irene, Hurricane Sandy and Snowstorm Jona.
 City-level water-energy nexus in Beijing-Tianjin-Hebei region
Applied Energy | November 13, 2018
Water-energy nexus in a city can either prompt or undermine its development. Yet in China, the relevant research is rarely found. This study accounts the city-level water-energy nexus in Beijing-Tianjin-Hebei region in 2012 from both production and consumption perspectives, where input-output analysis based on city-level input-output tables are applied to conduct consumption-based accounts.
 Life-cycle water uses for energy consumption of Chinese households from 2002 to 2015
Journal of Environmental Management | November 12, 2018
China's household energy demands' life-cycle water uses from 2002 to 2015 are quantified with an Input-Output analysis disaggregating rural and urban impacts. 9.73 and 1.60 km3 of water was withdrawn and consumed respectively in the life cycle of Chinese household energy demands in 2015, which was dominated by power and heat uses.
 Loss of work productivity in a warming world: Differences between developed and developing countries
Applied Energy | November 09, 2018
Carbon emission inventories are the foundations of climate change mitigation and adaptation in cities. In this study, we estimated production-based CO2 emissions from fossil fuel combustion and industrial processes in eleven cities in Hebei Province of China in 2012 and used input-output theory to measure their consumption-based CO2 emissions. We found that six developed cities were consumers with import-depended trade patterns.
 Loss of work productivity in a warming world: Differences between developed and developing countries
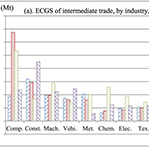
Energy Economics | October 24, 2018
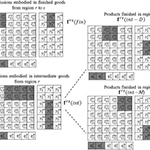
Multiregional input-output (MRIO) analysis, which links producers and final consumers, is a widely-used method for quantifying the EEIT. However, the role of intermediate trade in driving changes in the EEIT is still not fully incorporated in MRIO analysis and as a result poorly understood. Here, we present a framework that separately identifies the drivers of the emissions embodied in the trade of final and intermediate products.
 Loss of work productivity in a warming world: Differences between developed and developing countries
Journal of Cleaner Production | October 09, 2018
Comparable estimates of the heat-related work productivity loss (WPL) in different countries over the world are difficult partly due to the lack of exact measures and comparable data for different counties. In this study, we analysed 4363 responses to a global online survey on the WPL during heat waves in 2016. The participants were from both developed and developing countries, facilitating estimates of the heat-related WPL across the world for the year.
 Cities: the core of climate change mitigation
Journal of Cleaner Production | October 06, 2018
Cities, the core of the global climate change mitigation and strategic low-carbon development, are shelters to more than half of the world population and responsible for three quarters of global energy consumption and greenhouse gas (GHG). This special volume (SV) provides a platform that promotes multi- and inter- disciplinary analyses and discussions on the climate change mitigation for cities.
 Temporal change in India’s imbalance of carbon emissions embodied in international trade
Applied Energy | September 27, 2018
In India, rapid industrialization and reorganization of the global supply chain are driving economic growth, accompanied by increasing exports and carbon emissions. India is poised to succeed China as the next world manufactory, which will lead to huge emissions in the country. To formulate appropriate emission mitigation measures, it is necessary to further understand the temporal change in India’s emissions at the sectoral level from both the production and consumption perspectives.
 Assessment of the pollution–health–economics nexus in China
Atmospheric Chemistry and Physics | October 09, 2018
Health studies rarely consider macroeconomic impacts of industrial interlinkages while disaster studies seldom involve air pollution and its health consequences. This study adopts a supply-driven input–output model to estimate the economic loss resulted from disease-induced working-time reduction across 30 Chinese provinces in 2012 using the most updated Chinese multiregional input–output table.
 Distinguishing Emission-Associated Ambient Air PM2. 5 Concentrations and Meteorological Factor-Induced Fluctuations
Environmental science & technology | August 17, 2018
Although PM2.5 (particulate matter with aerodynamic diameters less than 2.5 μm) in the air originates from emissions, its concentrations are often affected by confounding meteorological effects. Therefore, direct comparisons of PM2.5 concentrations made across two periods, which are commonly used by environmental protection administrations to measure the effectiveness of mitigation efforts, can be misleading.
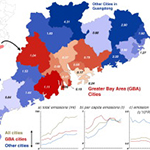 Emissions and low-carbon development in Guangdong-Hong Kong-Macao Greater Bay Area cities and their surroundings
Applied energy | July 18, 2018
Cities are the major contributors to energy consumption and CO2 emissions, as well as being leading innovators and implementers of policy measures in climate change mitigation. Guangdong-Hong Kong-Macao Greater Bay Area (GBA) is an agglomeration of cities put forward by China to strengthen international cooperation among “Belt and Road” countries and promote low-carbon, inclusive, coordinated and sustainable development.
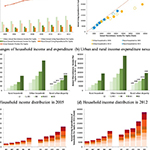 Integrating Sustainability Into City-level CO2 Accounting: Social Consumption Pattern and Income Distribution
Ecological Economics | July 05, 2018
The economy-environment-society nexus should be incorporated into city-scale CO2 accounting. Therefore, in this study, the semi-closed IO model is integrated with a HEM to calculate CO2 emissions arising from the social consumption pattern and income distribution, and to explore economic drivers behind CO2 variations. This method is applied to a case study of Beijing.
 Estimating household air pollution exposures and health impacts from space heating in rural China
Environment international | June 27, 2018
HAP from space heating using solid fuels, prevalent in countries at middle or high altitudes, is less studied and missing from the GBD assessment. China is an ideal example to estimate the bias of exposure and burden of diseases assessment when space heating is neglected, considering its remarkably changing demands for heating from the north to the south and a large solid-fuel-dependent rural population.
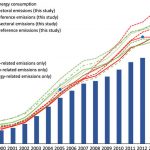
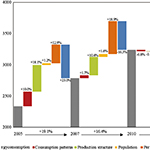 China's energy consumption in the new normal
Earth's Future | June 15, 2018
As the largest energy consumer worldwide, China has entered a new economic development model—the “new normal.” This study aims to explore the pattern shift in China's energy consumption growth in this new development phase. We use structural decomposition analysis and environmentally extended input‐output analysis to decompose China's energy consumption changes during 2005–2012 into five factors: population, efficiency, production structure, consumption patterns, and consumption volume.
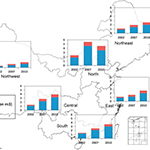
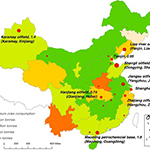 Rapid growth of petroleum coke consumption and its related emissions in China
Applied Energy | June 14, 2018
Petroleum coke, a non-environmentally friendly energy source, is gradually replacing other power fuels in China’s industrial enterprises because of its price advantage. Petroleum coke has high emission factors and thus emits more greenhouse gases (GHGs) and air pollutants than even raw coal. This study first examines the rapid growth of petroleum coke consumption in China since 2010 by industry sector and region and then estimates the petroleum coke-related emissions.
 Categorising virtual water transfers through China’s electric power sector
Applied Energy | June 04, 2018
Water consumption in thermoelectric and hydropower plants in China increased from 1.6 and 6.1 billion m3, respectively, to 3.8 and 14.6 billion m3 from 2002 to 2010. Using the concept of virtual water, we attribute to different electricity users the total water consumption by the electric power sector.
 The global CO2 emission cost of geographic shifts in international sourcing
Energy Economics | May 18, 2018
In this paper we simulated the global direct CO2 emission cost of geographic shift of international sourcing for the period 1995–2011 by comparing the scenarios with and without geographic shift. Our simulations indicate that in 2011, had the share of trade by the sourcing economy remained at the level of 1995, 2000, 2005, and 2008 whereas the global final demand remained the same, global CO2 emissions in production processes would have been 2.8 Gt, 2.0 Gt, 1.3 Gt, and 540 Mt., respectively, lower than the actual emissions.
 Energy and carbon intensity: A study on the cross-country industrial shift from China to India and SE Asia
Applied Energy | May 14, 2018
A cross-country shift of industrial output would present challenges for controlling emissions since India and SE Asian countries present higher industrial emissions intensity than China. We find that although there is a convergence in emissions intensity in the machinery manufacturing and paper and pulp industries, there are significant variations in all other industrial sectors.
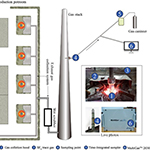 Estimating perfluorocarbon emission factors for industrial rare earth metal electrolysis
Resources, Conservation and Recycling | May 11, 2018
Rare earth (RE) metals have been widely applied in new materials, leading to their drastic production increase in the last three decades. In the production process featured by the molten-fluoride electrolysis technology, perfluorocarbon (PFC) emissions are significant and therefore deserve full accounting in greenhouse gas (GHG) emission inventories. Yet, in the ‘2006 IPCC Guidelines for National Greenhouse Gas Inventories’, no method currently exists to account for PFC emissions from rare earth metal production.
 exported carbon” peak: patterns, drivers, and implications
Geophysical Research Letters | April 24, 2018
This study estimates the driving forces of Chinese export‐embodied carbon emissions in the new normal phase, based on environmentally extended multiregional input‐output modeling and structural decomposition analysis. We find that Chinese export‐embodied CO2 emissions peaked in 2008 at a level of 1,657 million tones. The subsequent decline in CO2 emissions was mainly due to the changing structure of Chinese production.
 Origin and Radiative Forcing of Black Carbon Aerosol: Production and Consumption Perspectives
Environmental science & technology | April 24, 2018
Black carbon (BC), emitted from incomplete combustion, is a unique but representative particulate pollutant. This study tracked down the BC aerosol and its direct radiative forcing to the emission sources and final consumers using the global chemical transport model (MOZART-4), the rapid radiative transfer model for general circulation simulations (RRTM), and a multiregional input–output analysis (MRIO).
 The comprehensive environmental efficiency of socioeconomic sectors in China: An analysis based on a non-separable bad output SBM
Journal of Cleaner Production | March 1, 2018
The increasingly high frequency of heavy air pollution in most regions of China signals the urgent need for the transition to an environmentally friendly production performance by socioeconomic sectors. Focusing on CO2 and major air pollutants, this paper presents a comprehensive environmental efficiency index based on evaluating the environmental efficiency of major socioeconomic sectors, including agriculture, power, industry.
 A review of air pollution impact on subjective well-being: Survey versus visual psychophysics
Journal of Cleaner Production | February 27, 2018
Air pollution is a worldwide environmental and health issue, especially in major developing countries. A recent World Health Organization report shows about 3 million deaths in the world in 2012 are due to ambient air pollution and China and India are the countries with the most severe challenge. Air pollution influences people's thought and experience of their lives directly by visual perceptions. This reduces people's subjective well-being (SWB) to a significant degree.
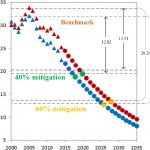 How modifications of China's energy data affect carbon mitigation targets
Energy Policy | February 24, 2018
Frequent modifications to energy statistics have led to considerable uncertainty in China's ability to achieve its carbon mitigation targets. Here, we quantitatively measure the impact of energy data revisions on China's ability to achieve its mitigation targets.
 Carbon emission imbalances and the structural paths of Chinese regions
Applied Energy | February 20, 2018
As the Chinese regions become more and more connected to each other and foreign countries, this study aims to address carbon imbalance and outsourcing issues in China. Using a production-based carbon emission inventory and a China-global multi-regional input-output model, this study estimates the consumption-based carbon emissions in 30 Chinese regions in 2007 and 2010.
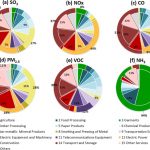
 Reconciling discrepancies in the source characterization of VOCs
Science of The Total Environment | February 20, 2018
By utilizing a highly resolved speciated regional EI and a region-wide gridded volatile organic compounds (VOCs) speciation measurement campaign, we elucidated underlying factors for discrepancies between EI and RM and proposed ways for their interpretations with the aim to achieve a scientifically plausible source identification.
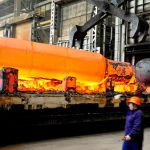 Multi-objective analysis of the co-mitigation of CO2 and PM2.5 pollution by China's iron and steel industry
Journal of Cleaner Production | February 16, 2018
The simultaneous reduction of CO2 emissions and PM2.5 pollution while minimizing the total mitigation costs remains a crucial issue that must be resolved. Using a multi-objective analysis, we compared potential technology combinations based on various policy preferences and targets.
 The spatiotemporal features of greenhouse gases emissions from biomass burning in China from 2000 to 2012
Journal of Cleaner Production | February 03, 2018
The spatiotemporal features of biomass burning sources and greenhouse gases emissions have not been comprehensively uncovered. This research undertook IPCC bottom-up inventory guideline to estimate Chinese greenhouse gases emissions from biomass burning and applied geographical information system to reveal biomass burning emissions spatiotemporal features.
 Patterns of CO2 emissions in 18 central Chinese cities from 2000 to 2014
Journal of Cleaner Production | January 20, 2018
With the Rise of Central China Plan, the central region has had a great opportunity to develop its economy and improve its original industrial structure. However, this region is also under pressure to protect its environment, keep its development sustainable and reduce carbon emissions. Therefore, accurately estimating the temporal and spatial dynamics of CO2 emissions and analysing the factors influencing these emissions are especially important.
 China CO2 emission accounts 1997–2015
Scientific Data | January 16, 2018
China is the world’s top energy consumer and CO2 emitter, accounting for 30% of global emissions. Compiling an accurate accounting of China’s CO2 emissions is the first step in implementing reduction policies. However, no annual, officially published emissions data exist for China. The current emissions estimated by academic institutes and scholars exhibit great discrepancies. The gap between the different emissions estimates is approximately equal to the total emissions of the Russian Federation (the 4th highest emitter globally) in 2011.
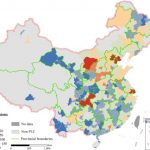 Local strategies for China's carbon mitigation
Journal of Cleaner Production | January 08, 2018
This paper provides a systematic analysis that identifies the driving forces of carbon dioxide (CO2) emissions of 286 Chinese prefecture-level cities in 2012. The regression analysis confirms the economic scale and structure effects on cities' CO2 emissions in China.
 Chinese CO2 emission flows have reversed
Nature Communication | November 23, 2017
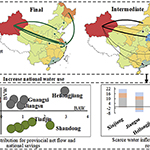
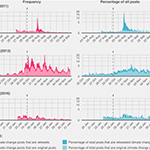
we show that emission flow patterns have changed greatly in both domestic and foreign trade since the financial crisis. Some economically less developed regions, such as Southwest China, have shifted from being a net emission exporter to being a net emission importer. In terms of foreign trade, emissions embodied in China’s exports declined from 2007 to 2012 mainly due to changes in production structure and efficiency gain.
 Assessment of the economic impacts of heat waves
Journal of Cleaner Production | October 09, 2017
Extreme heat can not only induce health outcomes in terms of excess mortality and morbidity (hospital admissions) but can also cause productivity losses for self-paced indoor workers and capacity losses for outdoor workers due to occupational safety requirements. All of these effects can be translated into productive working time losses, thus creating a need to investigate the macroeconomic implications of heat waves on production supply chains.
 Flood footprint of the 2007 floods in the UK
Journal of Cleaner Production | September 09, 2017
These disasters represent high costs and functional disruptions to societies and economies. The consequent breakdown of the economic equilibrium exacerbates the losses of the initial physical damages and generates indirect costs that largely amplify the burden of the total damage. Neglecting indirect damages results in misleading results regarding the real dimensions of the costs and prevents accurate decision-making.
 Energy and emission in Tibet and cites
Earth Future | August 09, 2017
Tibet Autonomous Region has historically been excluded from China's reported energy statistics, including those regarding CO2 emissions. In this paper, we estimate Tibet's energy consumption using limited online documents, and we calculate the 2014 energy-related and process-related CO2 emissions of Tibet and its seven prefecture-level administrative divisions for the first time.
 Global emission growth after international crisis
Energy Policy | August 04, 2017
In this paper, we decompose the driving forces of global CO2 emissions for the post-crisis era 2008–2011 from both production-based and consumption-based aspects. The results suggest that non-OECD economies have become the major drivers for the rapid global growth of CO2 emissions after the crisis. The increasing consumption and investment of non-OECD economies, have largely contributed to global growth of CO2 emissions after 2009.
 Multi-scale input-output analysis of consumption-based water resources: Method and application
Journal of Cleaner Production | June 19, 2017
This work develops a method of multi-scale input-output analysis for the embodied water accounting of an economy. This method can distinguish between the different virtual water contents of imported and local products and is therefore capable of estimating the virtual water that is embodied in trade.
 City level emission accounts: method and application
Journal of Cleaner Production | June 14, 2017
Cities contribute 85% of the total CO2 emissions in China and thus are considered as the key areas for implementing policies designed for climate change adaption and CO2 emission mitigation. However, the emission inventory construction of Chinese cities has not been well researched, mainly owing to the lack of systematic statistics and poor data quality.
 Demand-driven air pollution in Guangdong
Applied Energy | July 11, 2017
Guangdong is one of many fast-developing regions in China that are confronting the challenges of air pollution mitigation and sustainable economic development. In this study, we used environmentally extended input-output analysis with well-established production-based emission inventories to develop a consumption-based emission inventory for seven pollutants in the years 2007 and 2012.
 Pattern changes in determinants of Chinese emissions
Environmental Research Letters | March 29, 2017
Chinese economy has been recovering slowly from the global financial crisis, but it cannot achieve the same rapid development of the pre-recession period. Instead, the country has entered a new phase of economic development – a "new normal". We use a structural decomposition analysis (SDA) and environmental input-output analysis (IOA) to estimate the determinants of China's carbon emission changes during 2005-2012.
 Performance of China’s Emission-Trading Scheme
Engineering | February 28, 2017
China recently announced the launch of a nation-wide emission-trading scheme (ETS) starting in 2017 in order to help deliver its emission peak by 2030. A number of climate policies in China are ongoing, and require a full performance review, effective coordination, and appropriate implementation of planning and monitoring measures along with any newly added mechanisms.
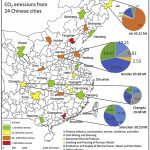
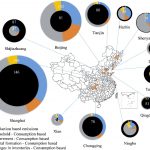
 Consumption-based black carbon of China's cities
Journal of Cleaner Production | February 27, 2017
We calculate the production-based and consumption-based emissions in 2012 in four Chinese megacities: Beijing, Shanghai, Tianjin and Chongqing. The results show that capital formation is the largest contributor, accounting for 37%–69% of consumption-based emissions. Approximately 44% of BC emissions related to goods consumed in Chongqing and more than 60% for Beijing, Shanghai and Tianjin occur outside of the city boundary.
 Variations of China's emission estimates
Atmospheric Physics and Chemistry | January 25, 2017
The accuracy of China’s energy statistics is of great concern because it contributes greatly to the uncertainties in estimates of global emissions. This study attempts to improve the understanding of uncertainties in China’s energy statistics and evaluate their impacts on China’s emissions during the period of 1990–2013.
 Multiple disasters management: Lessons from the Fukushima triple events
Economic Analysis and Policy | January 07, 2016
This study summarize management and policy lessons from the GEJE. The recovery efforts that followed the triple disasters: the earthquake, tsunami and meltdown of the Fukushima Dai-ichi nuclear plant are in progress. The experience of the GEJE and tsunami prompted the building of embankments throughout the Pacific coastal side of the Tohoku region.
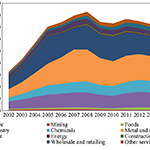
 Income-Based Greenhouse Gas Emissions of Nations
Environmental Science and Technology | December 09, 2016
The rapid development of mining industries drives income-based GHG emissions of resource-exporting nations (e.g., Australia, Canada, and Russia) during 1995–2009. Moreover, the rapid development of sectors producing basic materials and providing financial intermediation services drives income-based GHG emissions of developing nations.
 Global carbon uptake by cement carbonation
Nature Geoscience | November 21, 2016
Calcination of carbonate rocks during the manufacture of cement produced 5% of global CO2emissions from all industrial process and fossil-fuel combustion in 2013. Here, we use new and existing data on cement materials during cement service life, demolition, and secondary use of concrete waste to estimate regional and global CO2 uptake between 1930 and 2013 using an analytical model describing carbonation chemistry.
 Carbon emissions of Beijing in 2012
Environmental Research Letters | November 17, 2016
Income-based accounting method reveals new GHG emission profiles for nations and sectors. The rapid development of mining industries drives income-based GHG emissions of resource-exporting nations (e.g., Australia, Canada, and Russia) during 1995–2009. Moreover, the rapid development of sectors producing basic materials and providing financial intermediation services drives income-based GHG emissions of developing nations.
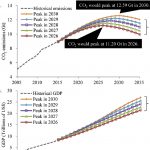 Socioeconomic impact of China's emissions peak
Journal of Cleaner Production | November 17, 2016
We present an Integrated Model of Economy and Climate, an optimization model based on the input-output model. The model is designed to assess the tradeoff between emission deceleration and economic growth. Given that China's projected average growth rate will exceed 5% over the next two decades, we find that China may reach its peak CO2 emissions levels by 2026.
 Tele-connecting local PM2.5 to global consumption
Proceeding A | November 16, 2016
Tele-connection is used here to represent the link between production and consumption activity at large distances. In this study, we develop a global consumption-based primary PM2.5 emission inventory to track primary PM2.5 emissions embodied in the supply chain and evaluate the extent to which local PM2.5 emissions are triggered by international trade.
 Mitigation in Chinese cities residential sector
Applied Energy | August 08, 2016
Focusing on Beijing and Shanghai, this paper carries out a measures-based economic analysis of low carbon investment opportunities in the residential sector. Results find significant opportunity: between 2015 and 2030, BAU levels of CO2 emissions could be reduced by 10.2% in Beijing and 6.8% in Shanghai with the adoption of economically attractive low carbon measures.
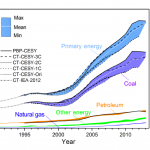
 Determinants of global CO2 emissions growth
Applied Energy | July 16, 2016
This paper analyzes global CO2 emissions growth by fossil fuel type (coal, oil or gas), demand type (consumption or investment), country group (developed or developing country) and industry group. The results indicate that, among the three fossil fuels, CO2 emissions from coal use grew the most rapidly in developing countries, by 3.76 Gt in the period 1995–2009. By contrast, CO2 emissions from natural gas use grew the most rapidly in developed countries, by 470 Mt in the period 1995–2009.
 Risk assessment of oil price
Applied Economics | July 14, 2016
The price gap between West Texas Intermediate (WTI) and Brent crude oil markets has been completely changed in the past several years. The price of WTI was always a little larger than that of Brent for a long time. However, the price of WTI has been surpassed by that of Brent since 2011. The new market circumstances and volatility of oil price require a comprehensive re-estimation of risk. Therefore, this study aims to explore an integrated approach to assess the price risk in the two crude oil markets through the value at risk (VaR) model.
 Global climate forcing and international trade
Nature Geoscience | September 05, 2016
We contrast the direct radiative forcing of aerosols related to regions’ consumption of goods and services against the forcing due to emissions produced in each region. We find that global aerosol radiative forcing due to emissions produced in East Asia is much stronger than the forcing related to goods and services ultimately consumed in that region because of its large net export of emissions-intensive goods.
 Take responsibility for electronic-waste disposal
Nature | August 03, 2016
The world is producing ever more electrical and electronic waste. The quantity of dumped computers, telephones, televisions and appliances doubled between 2009 and 2014, to 42 million tonnes per year globally. China processed about 70% of the world’s e-waste in 2012; the rest goes to India and other countries in eastern Asia and Africa, including Nigeria. Non-toxic components — such as iron, steel, copper and gold — are valuable, so are more frequently recycled than toxic ones.
 Inter-regional trade flows in China
Journal of Geographical Sciences | August 05, 2015
China has huge differences among its regions in terms of socio-economic development, industrial structure, natural resource endowments, and technological advancement. These differences have created complicated linkages between regions in China. In this study, we develop a sector-specific model to estimate inter-provincial trade flows, which is the base for making a multi-regional input-output table.
 Consumption-based emission accounting for Chinese cities
Applied Energy | June 23, 2016
We employ an input-output model to calculate consumption-based CO2 emissions for thirteen Chinese cities and find substantial differences between production- and consumption-based accounting in terms of both overall and per capita carbon emissions. Urban consumption not only leads to carbon emissions within a city’s own boundaries but also induces emissions in other regions via interregional trade.
 Electrical vehicles and emissions mitigation in China
Applied Energy | June 11, 2016
Replacement of gasoline cars with EVs causes greater impacts on total gasoline production than on total electricity generation. The gasoline vehicle replacement with EVs, powered by 80% coal, has no effect on overall emissions. The CO2 emissions reduction in the petroleum sector is offset by the increase in CO2 emissions in the electricity sector, leaving the national CO2 emissions unchanged.
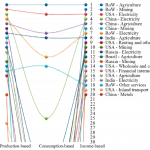
 Socioeconomic Drivers of GHGs in the US
Environmental Science & Technology | June 08, 2016
This study investigates GHG emissions of sectors in the U.S. from production-based (direct emissions), consumption-based (upstream emissions driven by final consumption of products), and income-based (downstream emissions enabled by primary inputs of sectors) viewpoints. We also quantify relative contributions of socioeconomic factors to the US’s GHG emission changes during 1995–2009 from both the consumption and supply sides.
 Emissions and trade: The post-China era
Applied Energy | May 21, 2016
The so-called post-China countries (PC-16́s), distinguished by low wages and high economic growth, will replace China as the “world’s factory”. The aim of this paper is to assess the effect of these changes on global CO2 emissions pathways. To achieve this, a counterfactual is proposed wherein China’s trade with the rest of the world is replaced by the PC-16’s trade in a global multiregional input–output context.
 CO2 Emissions from China’s Lime Industry
Applied Energy | May 18, 2015
China is now the world’s leading energy consumer and CO2 emitter; therefore, precise quantification of the CO2 emissions that occur in China is of serious concern. Although most studies focus on CO2 emissions from fossil fuel combustion and cement production, the emissions from lime production is not well researched. Lime production is the second largest source of carbon emissions from industrial processes after cement production.
 Socioeconomic costs to China’s air pollution
Atmospheric Environment | May 20, 2016
This paper utilized a supply-driven input-output (I-O) model to estimate the monetary value of total output losses resulting from reduced working time caused by diseases related to air pollution across 30 Chinese provinces in 2007.
 Virtual Water Flows in the EU27
Journal of Industrial Ecology | May 19, 2016
Using current economic and environmental data, we conduct a consumption-based assessment of virtual water flows in the European Union (EU27). We find that the total water footprint (WF) of 2,280 cubic meters (m3) per capita for the EU27 mostly consists of green water use (precipitation stored as soil moisture), which is omitted in the conventional water accounting.
 China's air pollution from production and consumption approaches
Environmental Science & Technology | November 17, 2014
Two important reasons for China’s air pollution are the high emission factors (emission per unit of product) of pollution sources and the high emission intensity (emissions per unit of GDP) of the industrial structure. Therefore, a wide variety of policy measures, including both emission abatement technologies and economic adjustment, must be implemented.
 Driving forces of Chinese primary air pollution emissions
Journal of Cleaner Production | May 11, 2016
This study provides an interdisciplinary study to investigate the key contributors driving air pollution emissions changes in China from 1997 to 2012, by applying the Logarithmic Mean Divisia Index method. The decomposition results are presented in both multiplicative and additive approaches to show the relative and absolute contribution of each factor in affecting emission changes.
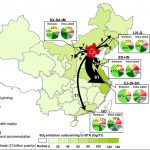 Environment-economy tradeoff for Beijing regions
Applied Energy | April 19, 2016
Balancing economic gains and environmental consequences induced by trade is still hindered by a lack of quantification of these two factors, especially for the environmental problems those are more locally oriented, such as the atmospheric pollution. Our results show that exports contributed 55–62% of BTH’s production emissions and 54% of its total value added.
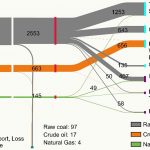 New provincial CO2 emission inventories in China
Applied Energy | April 19, 2016
The study presents the changing emission-socioeconomic features of each provinces as well. The results indicate that Chinese provincial aggregated CO2 emissions calculated by the apparent energy consumption and updated emissions factors are coincident with the national emissions estimated by the same approach, which are 12.69% smaller than the one calculated by the traditional approach and IPCC default emission factors.
 Revisiting global net emission transfers
Journal of Industrial Ecology | March 11, 2016
processing exports in China involves relatively lower CO2 emissions than other production types for the same output levels. Therefore, if processing exports are not appropriately distinguished, net CO2 emission exports from China to other regions will be distorted; the relative bias occasionally reaches 15%.
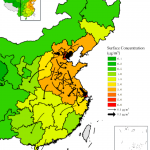 Interprovincial Reliance for Improving Air Quality in China
Environmental Science & Technology | March 07, 2016
The trade of goods among regions or nations associated with large environmental consequences. Yet balancing economic gains and environmental consequences induced by trade is still hindered by a lack of quantification of these two factors. Our results show that exports contributed 55–62% of BTH’s production emissions and 54% of its total value added.
 Techno-economic drivers of CO2 emission changes
Renewable and Sustainable Energy Reviews | December 05, 2015
This paper extends the previous logarithmic mean Divisia index (LMDI) decomposition model by introducing three novel factors (R&D intensity, investment intensity, and R&D efficiency).
A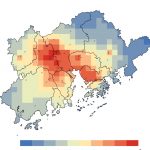 ir pollution and human health at Pearl River Delta
Environmental Research Letters | October 08, 2015
Following a series of extreme air pollution events, the Chinese government released the Air Pollution Prevention and Control Action Plan in 2013 (China's State Council 2013). The Action Plan sets clear goals for key regions (i.e. cities above the prefecture level, Beijing-Tianjin-Hebei Province, the Yangtze River Delta and the Pearl River Delta) and establishes near-term control efforts for the next five years. However, the extent to which the Action Plan can direct local governments' activities on air pollution control remains unknown.
 Intercomparison of global MRIO databases
Economic Systems Research | March 01, 2016
Global trade models based on MRIO tables are being used to calculate important economic and environmental indicators such as value added in trade or the carbon footprint of nations. Such applications are highly relevant in international trade and climate policy negotiations, and consequently MRIO model results are being scrutinized for their accuracy and reproducibility.
 China's export related emissions, and the responsibility issue
Energy Economics | August 28, 2015
China's CO2 emissions and those embodied in its exports have been extensively studied. One often neglected aspect is the prevalence of foreign-invested enterprises (FIEs) in China's exports, for which a substantial portion of benefits return to the investing countries. In this paper, we revisit China's export-related CO2 emission responsibilities by viewing them from a “new”, gross national income perspective.
 Targeted opportunities to address the climate–trade dilemma in China
Nature Climate Change | September 28, 2015
International trade has become the fastest growing driver of global carbon emissions, with large quantities of emissions embodied in exports from emerging economies. International trade with emerging economies poses a dilemma for climate and trade policy: to the extent emerging markets have comparative advantages in manufacturing, such trade is economically efficient and desirable.
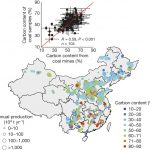 Reduced emission estimates in China
Nature | August 19, 2015
Estimates of Chinese emissions remain subject to large uncertainty; inventories of China’s total fossil fuel carbon emissions in 2008 differ by 0.3 gigatonnes of carbon, or 15 per cent. The primary sources of this uncertainty are conflicting estimates of energy consumption and emission factors. Here we re-evaluate China’s carbon emissions using updated and harmonized energy consumption and clinker production data and two new and comprehensive sets of measured emission factors for Chinese coal.
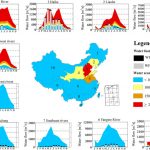 China’s rising hydropower demand challenges water sector
Scientific Reports | July 09, 2015
Demand for hydropower is increasing, yet the water footprints (WFs) of reservoirs and hydropower, and their contributions to water scarcity, are poorly understood. Here, we calculate reservoir WFs (freshwater that evaporates from reservoirs) and hydropower WFs (the WF of hydroelectricity) in China based on data from 875 representative reservoirs (209 with power plants).
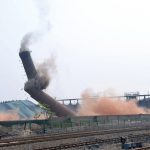 Steps to China’s carbon peak
Nature | June 17, 2015
In 2013, China released one-quarter of the global total of carbon dioxide for the year, and 1.5 times that released by the United States. It is the world's leading emitter of the gas. Without mitigation, China's CO2 emissions will rise by more than 50% in the next 15 years. Last November, in a joint announcement with the United States, China pledged that its CO2 emissions will peak by 2030. Existing policies are insufficient to make that happen.
 China's toxic informal e-waste recycling
Journal of Cleaner Production | June 01, 2015
Electronic waste or e-waste has been an increasingly severe problem over the last decade, and is the fastest growing waste stream in the world. China's inexpensive labour and manufacturing abilities have already made it “the world's factory” and for e-waste recycling it is no exception. Informal workers do the majority of e-waste collection and recycling in cities throughout China.
China's virtual air pollution transport
Atmospheric Physics and Chemistry | May 19, 2015
Understanding the mechanisms how the pollutant was transferred through economic and trade activities remains a challenge. For the first time, we quantified and tracked China's air pollutant emission flows embodied in interprovincial trade, using a multiregional input–output model framework.
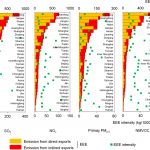 Revealing the hidden health costs embodied in Chinese exports
Environmental Science & Technology | March 09, 2015
China emits a considerable amount of air pollutants when producing goods for export. Previous efforts have emphasized the magnitude of export-related emissions; however, their health consequences on the Chinese population have not been quantified. Here, we present an interdisciplinary study to estimate the health impact of export-related air pollution.
 Four system boundaries for carbon accounts
Ecological Modelling | February 27, 2015
Knowing the carbon emission baseline of a region is a precondition for any mitigation effort, but the baselines are highly dependent on the system boundaries for which they are calculated. On the basis of sectoral energy statistics and a nested provincial and global multi-regional input–output model, we calculate and compare four different system boundaries for China's 30 provinces and major cities.
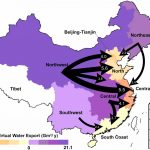 Physical and virtual water transfers in China
PNAS | January 12, 2015
Water can be redistributed through, in physical terms, water transfer projects and virtually, embodied water for the production of traded products. Here, we explore whether such water redistributions can help mitigate water stress in China. This study, for the first time to our knowledge, both compiles a full inventory for physical water transfers at a provincial level and maps virtual water flows between Chinese provinces in 2007 and 2030.
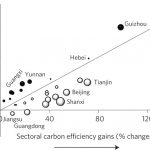 Determinants of Stagnating Carbon Intensity in China
Nature Climate Change | October 04, 2014
China committed itself to reduce the carbon intensity of its economy (the amount of CO2 emitted per unit of GDP) by 40–45% during 2005–2020. Yet, between 2002 and 2009, China experienced a 3% increase in carbon intensity, though trends differed greatly among its 30 provinces. Decomposition analysis shows that sectoral efficiency gains in nearly all provinces were offset by movement towards a more carbon-intensive economic structure.
 Lifting China’s Water Spell
Environmental Science & Technology | September 16, 2014
China is a country with significant but unevenly distributed water resources. The water stressed North stays in contrast to the water abundant and polluted South defining China’s current water environment. In this paper we use the latest available data sets and adopt structural decomposition analysis for the years 1992 to 2007 to investigate the driving forces behind the emerging water crisis in China.
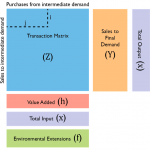 A Hybrid-Unit Energy Input-Output Model
Journal of Industrial Ecology | April 02, 2014
We develop a hybrid-unit energy input-output (I/O) model with a disaggregated electricity sector for China. The model replaces primary energy rows in monetary value, namely, coal, gas, crude oil, and renewable energy, with physical flow units in order to overcome errors associated with the proportionality assumption in environmental I/O analysis models. Model development and data use are explained and compared with other approaches in the field of environmental life cycle assessment.
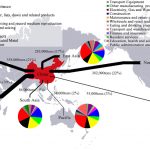 The socioeconomic drivers of China's primary PM2.5
Environmental Research Letters | February 19, 2014
We present an interdisciplinary study to measure the magnitudes of socioeconomic factors in driving primary PM2.5 emission changes in China between 1997–2010, by using a regional emission inventory as input into an environmentally extended input–output framework and applying structural decomposition analysis.
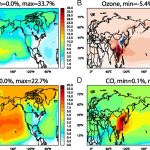 China’s international trade and air pollution in the United States
PNAS | February 04, 2014
International trade affects global air pollution and transport by redistributing emissions related to production of goods and services and by potentially altering the total amount of global emissions. Here we analyze the trade influences by combining an economic-emission analysis on China’s bilateral trade and atmospheric chemical transport modeling.
Too busy to update more...